We come into this world without the slightest idea of what is going on. It takes us a year or two just to manage to stand on our feet and say “dad.” We learn the facts of life gradually in the years that follow. Sometimes it is heartbreaking to watch a child realize for the first time what their favorite food is made of, that everyone dies eventually, or that Santa Claus is not real. Even after that, we need many more years to understand complex ideas such as “love,” “money,” or “war.” At times, it seems that educational figures avoid teaching us directly about topics that allow for diverse and even contradictory perspectives. The most striking example, in my view, is sex. One could almost say that my generation learned most of what it knows about sex from media, not necessarily from pornography. My argument here is that media functions as a mediating force for storytelling.
The following text will shine a light on a type of creation that seeks to provide us with knowledge: “racing bars” videos.
What Are “Racing Bars” Videos?
These are short videos (usually under 10 minutes) in which bars expand and contract according to data, overtaking one another over time. The best way to demonstrate the genre is through the following video, which I created myself:
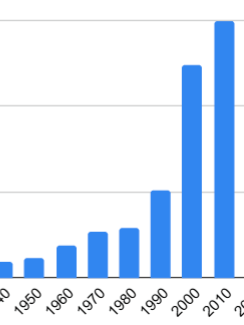
In this video, the population numbers of Israel’s largest cities are presented between the years 1900–2019. As can be seen, there are quite a few changes connected to the history of the State of Israel- the War of Independence (1948), major waves of immigration, and the growth of the Tel Aviv metropolitan area. Like reviewing tables or graphs, this is another way of presenting a story; an intensive method that stimulates the imagination and prompts the mind to search for explanations. In many videos of this genre, it is rare for specific historical events to be mentioned, and therefore the viewer must infer the causes behind the fluctuations.
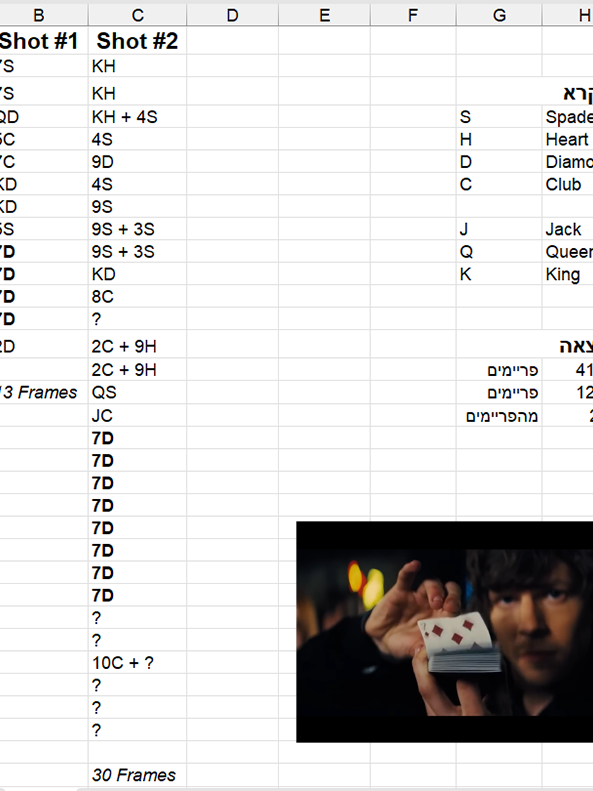
In terms of producing such videos, one of the platforms available is the website Flourish, where the creator is required to compile all the data for all entities into a single table. For that, the creator must collect not only the data for the city of Tel Aviv throughout its years of existence, but also for Modi’in and Bat Yam. The more data there is on more entities, the richer and more detailed the final video will look like. In such cases, this can sometimes be an exhausting process of digging and searching for information- especially when dealing with periods such as the British Mandate (1917-1948) or the Ottoman Empire (1516-1917), and with documentation from the early days of digitization processes. In the following project, which I worked on extensively, I had to contact the Technion and the Hebrew University in order to locate information from the years of their founding over a hundred years ago:
Some of the information I needed was easily found on the website of Israel’s Central Bureau of Statistics (CBS). In the days before the emergence of artificial intelligence (AI), this required a fair amount of browsing and emailing. Surprisingly, neither the CBS nor the Council for Higher Education (CHE) provides a publicly available table on this topic. Once colleges that later became universities are included, the picture becomes even more complex. Reichman University, formerly known as the “Interdisciplinary Center,” (IDC) did not receive much attention from CHE, and the same is true for Tel-Hai College, which is currently facing major changes.
After feeling stuck on this subject and being too busy with other matters, I abandoned the video in 2022. Surprisingly, this turned out to be worthwhile, because the arrival of AI made it easier to locate relevant official documents. In addition, the process of creating racing bars videos aligns well with procrastination; when I returned to complete the video, all I needed to do was find the data for the additional years that had passed and the data concerning new entities (Tel-Hai College), which had become relevant. This stands in contrast to a film, which might require reshooting entire scenes if the lead actor is replaced or undergoes a significant change in appearance.
Among the advantages of these videos are their ability to attract attention, to present shifts in dominance and power relations in relation to events, and to allow the simultaneous presentation of groups of entities that are intertwined (regions, industries, similar demographic divisions). It is possible to create such videos depicting changes in parliamentary seats, territorial control on maps, or the migration of celebrities throughout their lives, using other models of data.
Among the disadvantages of racing bars videos are the need to manually gather a large amount of data, the fact that the viewer must independently connect the causes behind changes in trends, and that the data expresses quantity rather than quality.
While media usually seeks to tell us a story, here the emphasis is on presenting data. We will not know why one army became larger than another, or whom to credit for that fact. But we can grasp the scale of the Second World War. This is a form of media without heroes, without a narrative structure, and without resolution at the end. What stands at the center here is information.
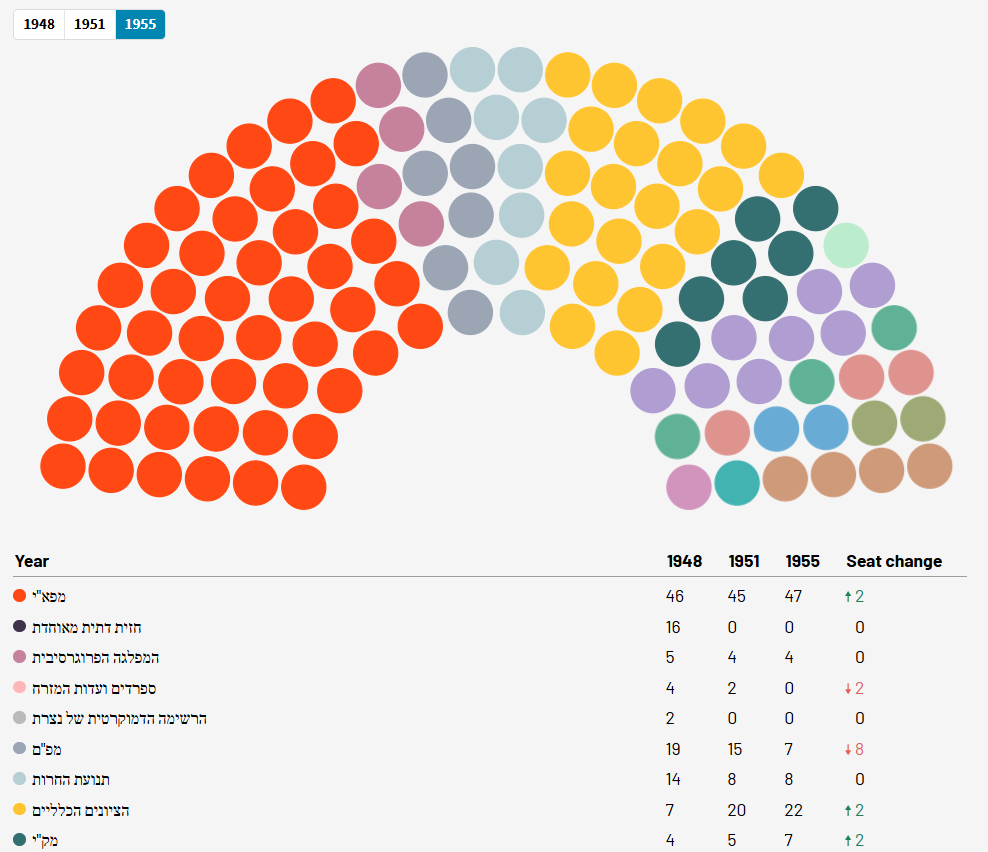
An attempt to show the shifts in the seats in the
Israeli Parliament, The Knesset
(screenshot from Flourish)
Israeli Parliament, The Knesset
(screenshot from Flourish)
I would like to mention the channel through which I learned about this genre, Data Is Beautiful. The channel features over 90 videos in this style. Watching them can be as tense as a horse race and as educational as a history lesson. It is always interesting to see how the scale grows throughout the video. I believe the key is to choose entities whose existence spans many years and is continuously updated at a rapid pace; even if an entity changes its name or identity, it may reappear later in a new form. Any video that succeeds in choosing its entities well will manage to spark interest.